Continuous Growth in the Delaware Valley Region
-- Forecasting Demand- and Supply-Driven Developments in 2020
To: Sean Thompson, Chair of the Delaware Valley Regional Planning Commission (DVRPC)
From: Leila Bahrami and Elizabeth Wang, Policy Analysts at Penn Urbanistics Initiative (PUSI)
Re: Continuous Growth in the Delaware Valley Region: Forecasting Demand- and Supply-Driven
Developments in 2020
————————————————————————–
1. Executive Summary
Comprehensive regional development rooted in multi-nodal growth engines has been the new
norm in the context of American urban planning. Cross-boundary collaboration brings benefits towards
resource distribution, a balanced growth and overall sustainable development. Conjoining Pennsylvania,
New Jersey, and Delaware and in proximity to New York City and Washington D.C., the Delaware
Valley Region (DVR) serves as an example of regional collaboration in growth management. With the
forecasts of next ten-to-thirty years development, the region witnesses the potential of increased
population joining the workforce, along with the expansion and enhancement of regional infrastructure
networks.
This report will summarize our recent study predicting future development demand based on
the demand-driven factor of population change and the supply-driven factor of infrastructure network
enhancement. It is predicted that development would intensify in Chester and Gloucester County as the
northern parts of Montgomery, Bucks and Burlington County. The development would be further
intensified along the proposed highway, concentrating in north Montgomery and Burlington County. The
findings provide insights for planners to formulate better policies to manage urban sprawl, leverage smart
growth and balance regional development.
2. Background
The DVR as core urban clusters of the Greater Philadelphia Region connects five adjacent states.
While population grew from 5.1 million to 5.6 million, the developed area expanded by 1.5 times,
signaling significant urban sprawl. The DVR region is forecasted to receive over 658,000 residents and
more than 372,000 job opportunities from 2015 to 2045. (DVRPC, 2017) The region will face severe
environmental damage if urban clusters continue sprawling at the preceding speed. Therefore, a
projection study of future development demand will help observe development patterns and strategically
alleviate sprawl through formulation of policy instruments.
3. Data and Study Methods
The study adopted a quantitative approach using spatial and demographic data, along with
regression analysis to predict future development demands.
3.1 Data
Data of land cover in 2000 to 2010 were obtained from USGS. 2010 and 2011 population census
and Esri Data and Maps have been referred to for demographic and transportation features. Population
and employment projections came from DVRPC’s studies.
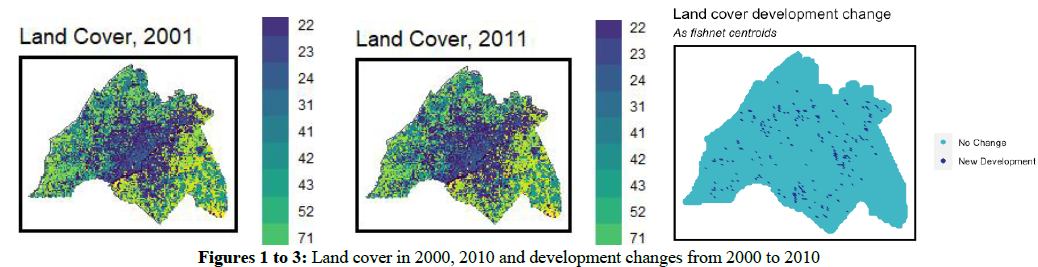
3.1.1 Land Cover Change as Development Indicators
The change of land cover from 2001 to 2011 indicates major developments in the decade.
(Figures 1 to 3)
3.1.2 Major Development Engines
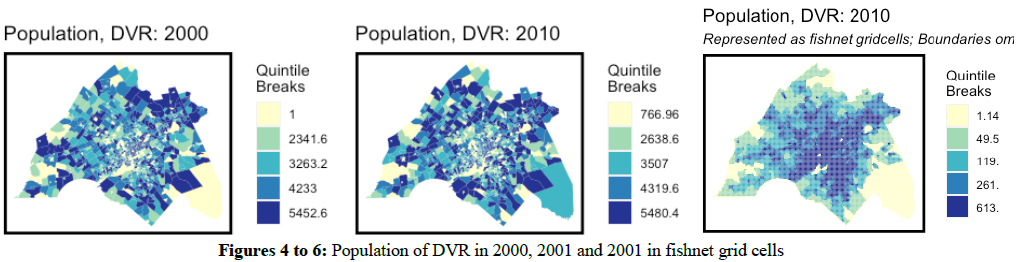
Population is the foremost driving factor in development since an increase in population will
bring about growth of density and employment. Intensive population growth has been observed in
Montgomery County and Bucks County in the north of Philadelphia, and northwest Gloucester County
and Burlington County. (Figures 4 to 6)
Road network is another critical development engine to consider. In view of the high level of
auto-dependency and consequently highway-oriented development patterns, our assumption is that
development demand is likely to occur near highways to access better connection to destinations.
(Figure 7)

3.2 Methods
To achieve a level of accuracy, the study divided the roughly 8 thousand square-kilometers land
into over 12 million grids and used the roughly one-acre grids as units of analysis. By joining spatial data
including land cover change, population distribution and distance to highway to the grids of both 2000
and 2010, we used logit regression analysis to study the development patterns <1>. Based on the hypothesis
that future development demand shares continuity of current development, the patterns learned from the
previous decade would serve as the model of development demands in the upcoming decades. Both
demand- and supply-side development demand are projected based on future population projection and a
proposed highway respectively.
4. Machine Learning of Development Patterns
4.1 Exploratory Analysis
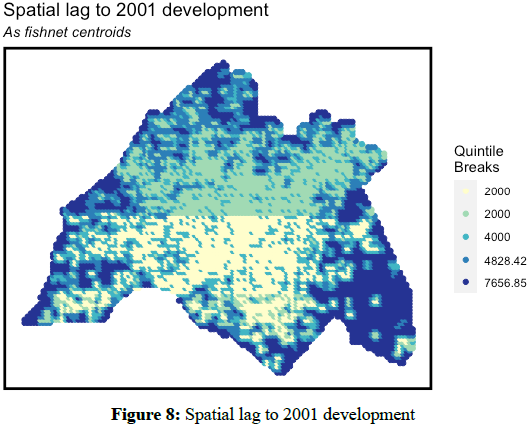
The spatial lag (i.e. the calculation of spatial weighted average) to 2001 development illustrates
development probabilities. Higher chance of development occurs in the periphery of the region and close
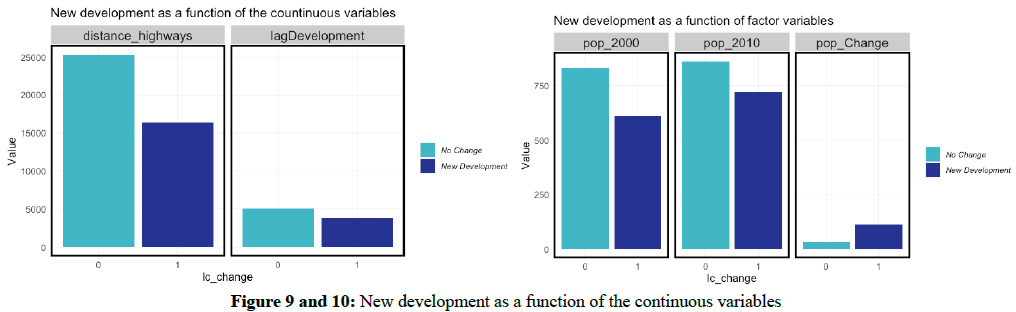
to certain sections of the highway networks. (Figures 8 and 9) Land cover change also indicated positive
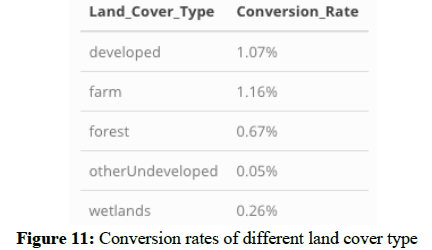
correlation with population change from 2000 to 2001. (Figure 10) Among different types of land cover,
farmland has the highest conversion rate, follow by developed land and forests, at 1.16%, 1.07%, and
0.67% respectively. (Figure 11)
4.2 2010 Prediction and evaluation
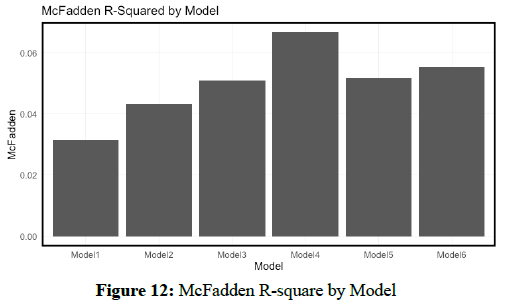
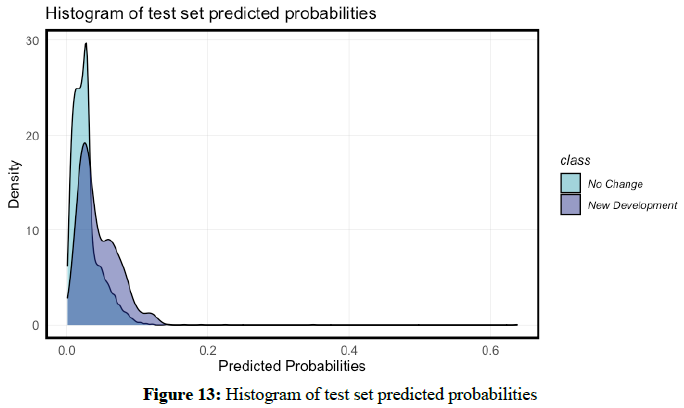
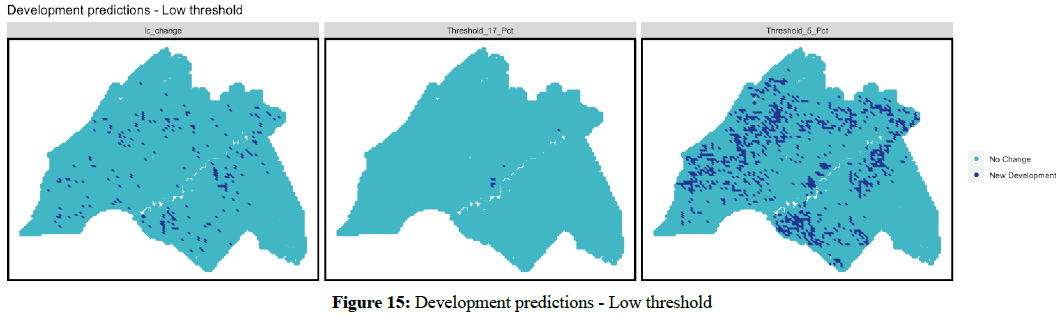
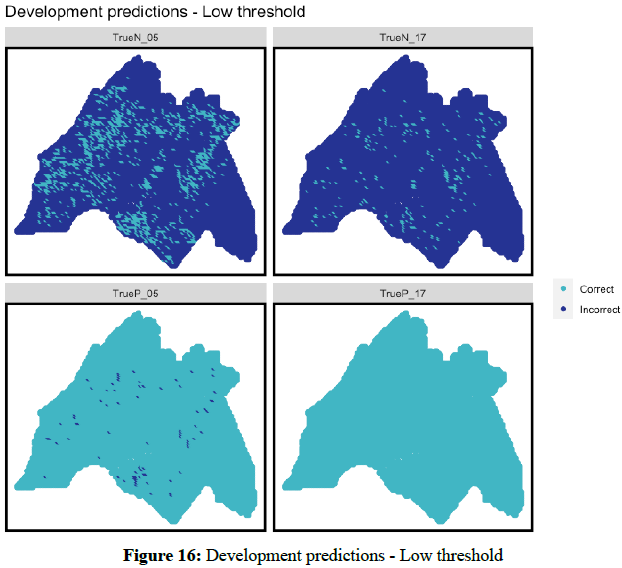
2010 prediction was based on analysis of six logit regression models. (Figure 12) As observed,
most developments have been predicted with probabilities of lower than 20%. (Figure 13) The model
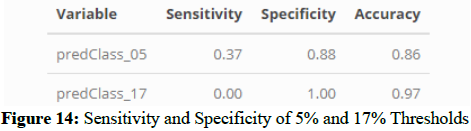
failed to provide robust results. For example, 5% threshold correctly predicts a lower number of new
development areas (Sensitivity) whereas incorrectly predicts a higher number of not changed areas
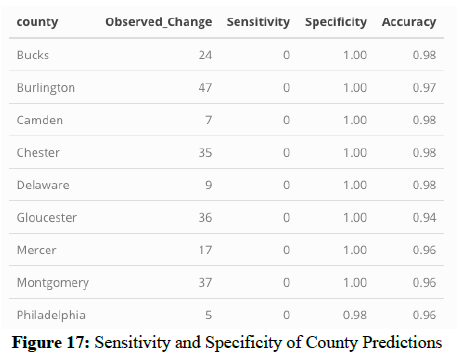
(Specificity). (Figure 14 to 16) Similarly, all counties demonstrate higher numbers of incorrect
predictions of not changed areas. (Figure 17) Thus this model is not representative enough (low
generalizability) in 2010 development prediction.
5. Predicted Demand of Development
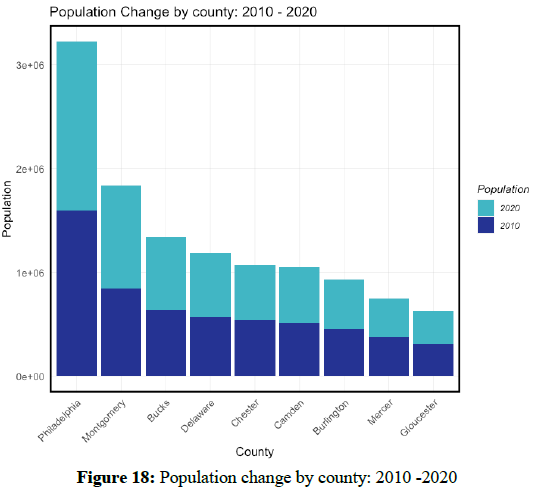
According to DVRPC (2016), population will continue increasing in the coming ten to thirty
years.<2> Chester County and Gloucester County will witness close to one-third of population growth – the
largest increase in density in the region.
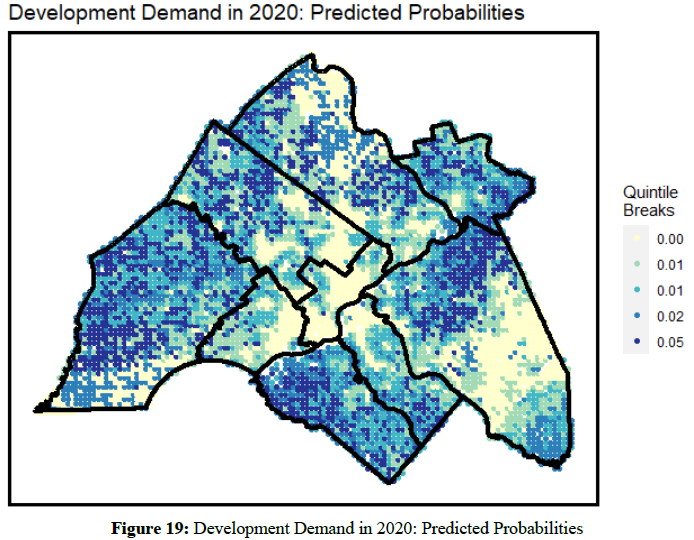
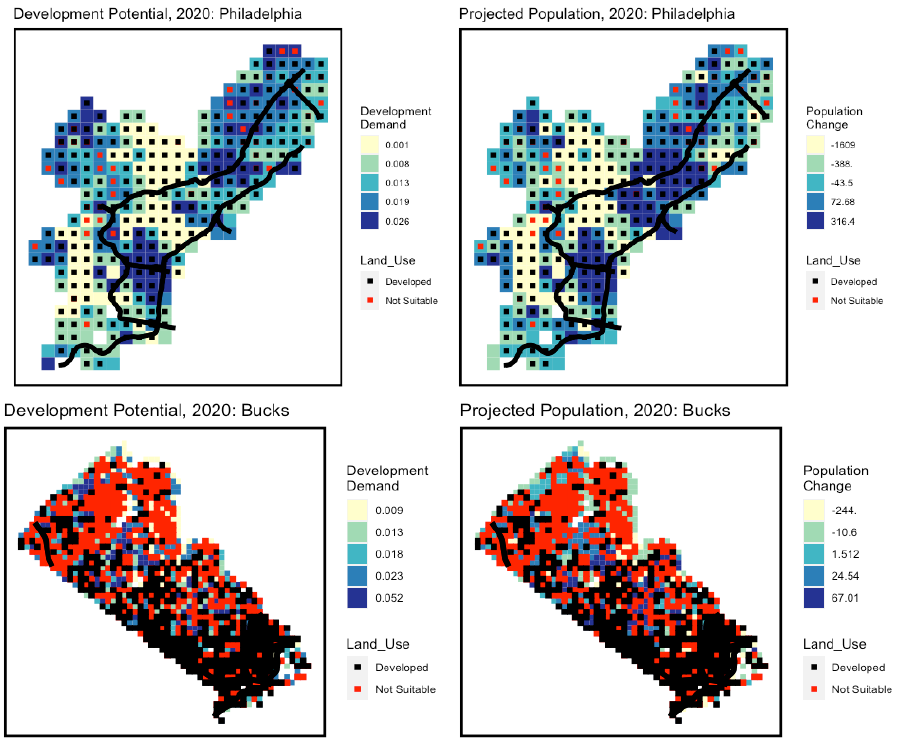
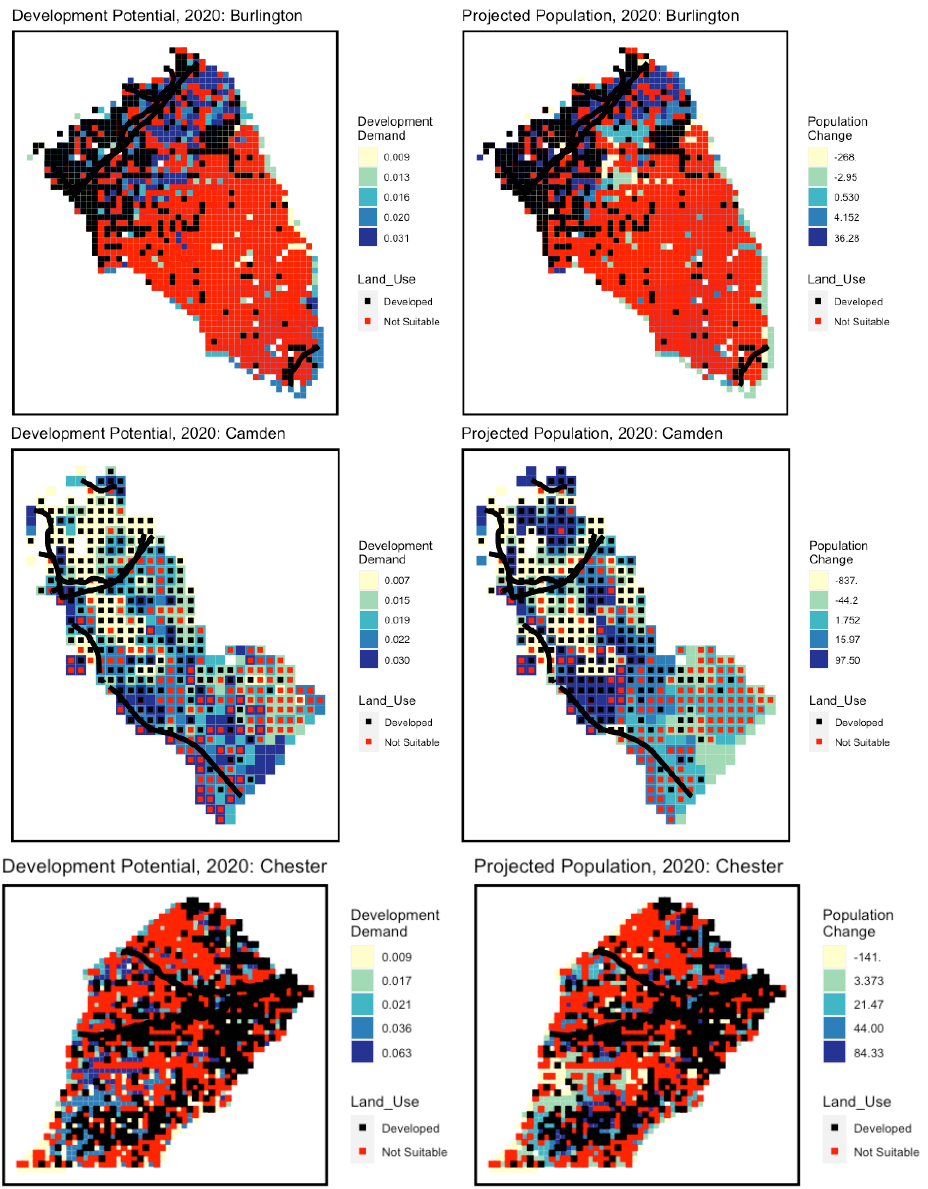
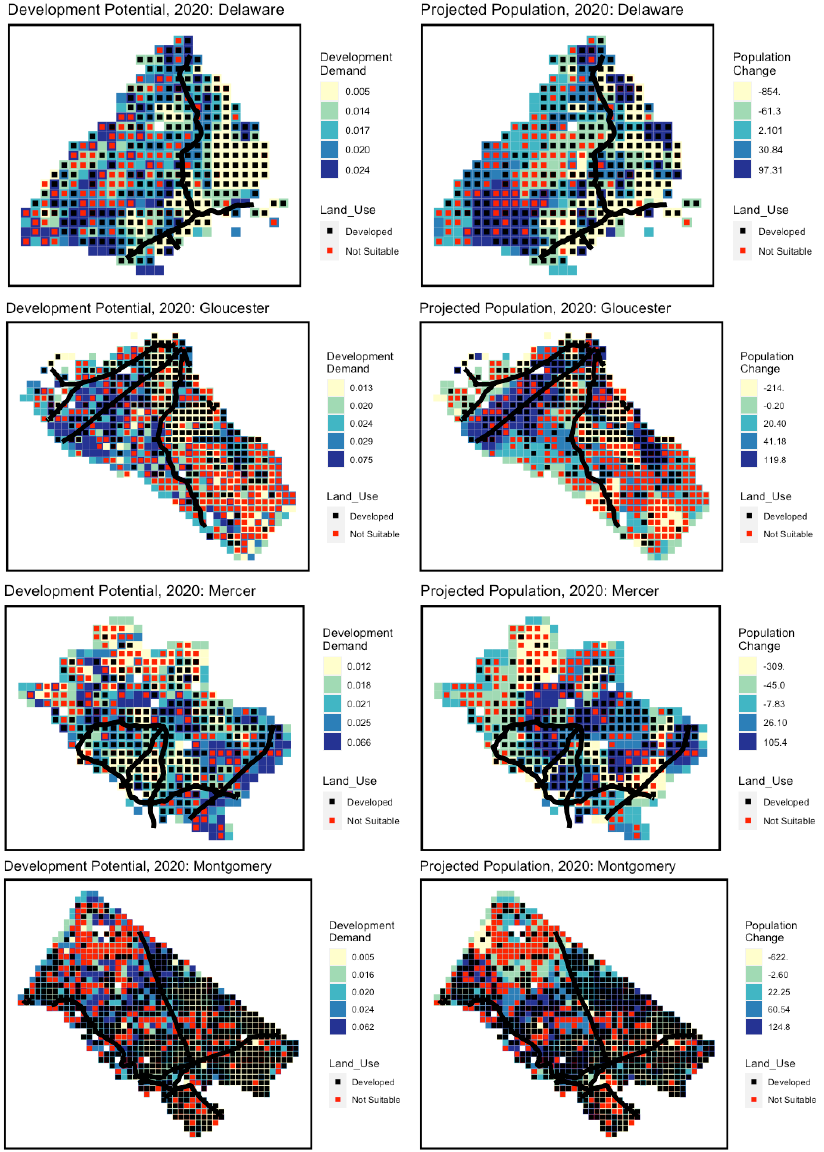
Similar trends of population change per county are demonstrated by the model. (Figure 18)
Based on the population projection in 2020, it is observed that development demand concentrates in
Chester and Gloucester Counties and the northern periphery of Bucks, Montgomery, Burlington and
Mercer Counties. (Figure 19)
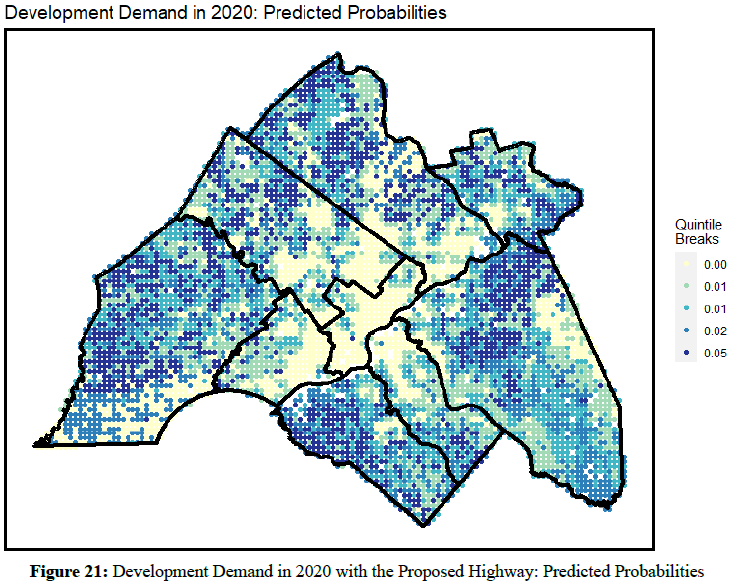
5.2 Supply-driven Development
Both Bucks County and Burlington County are projected among the lowest population growth
based on the current topography. However, both counties demonstrate potential connectors to edge cities
of the Greater Philadelphia Region – in particular, north Bucks County is projected to hold roughly 30%
to 50% increase of employment. (DVRPC, 2017) To leverage growth, a new highway is proposed
crossing North Philly, reaching the north crossing the boundary of Montgomery and Bucks County and
Burlington County, and connecting Allentown East and Atlantic City in the north and south respectively.
(Figure 20) The 2020 predicted development demands, therefore further intensify in Bucks and
Burlington Counties where the highway is proposed. (Figure 21)

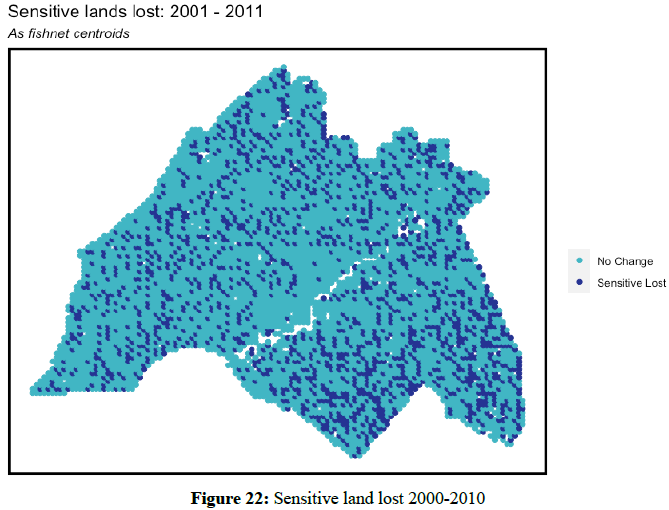
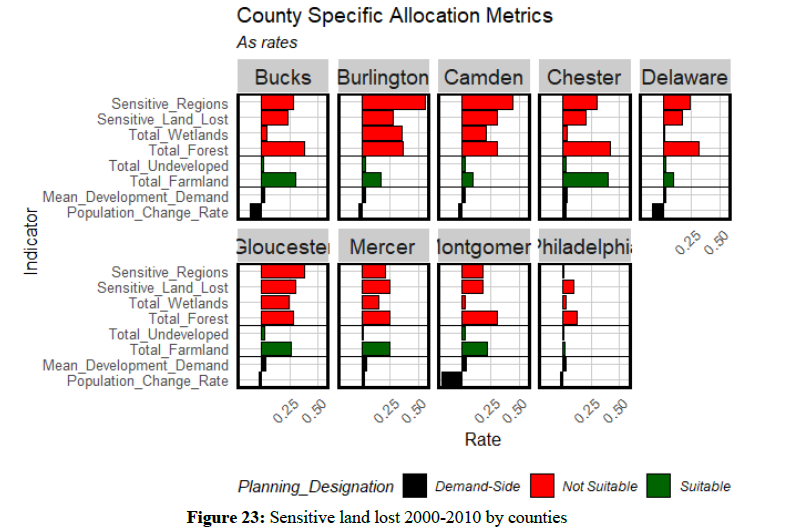
5.3 Environmental Sensitivity
An environmental sensitivity analysis cross-examines the effects of the proposed transportation
infrastructure. The predicted development, however, will evade forests and wetlands, as concentrated in
southern New Jersey and other counties. (Figure 22 and 23)
6. Discussions and Suggestions
The following figures summarize this study by showing the development potential of each
county. Development demand implies growth opportunities including jobs, real estate investment, small
business and retail supporting bedroom communities. On the other hand, however, the projected growth
in density unveiled a possible pattern of urban sprawl to north Bucks County. The proposed highway
further connects north Bucks County and South Jersey where most land is currently Conservation
Focused Areas (CFA). The environmental sensitivity analysis further revealed vulnerable preserved land
that may be invaded under urban sprawl. While the consequent highway-oriented development is
inevitable, your office is suggested to observe closely residential and commercial development along the
new highway. In particular, CFA should continue as a tool in the growth control mechanism. Your office
should work with relevant parties to study the land value and release land for development. Legislation
and regulations should be formulated as precaution of over-development.
Footnotes:
<1> Spatial lag of development will be used to identify current developed locations from 2000 to 2010 and logit
regression will be used to predict future developments.
<2> The projected population in 2020 are 640495, 840934, 543702, 1594787, 568337, 377328 , 514006, 307766,
459344 for Bucks County, Montgomery County, Chester County, Philadelphia County, Delaware County, Mercer
County, Camden County, Gloucester County, Burlington County respectively, according to DVRPC(2016)’s
population forecast. The projected population in 2040 are 691111, 918918, 645562, 1683402, 584329, 398669,
525101, 366383, 488026 respectively.
Reference
DVRPC (2016). “County and Municipal-Level Population Forecasts, 2015-2045”, website. Retrieved,
5/13/2020.
DVRPC (2017). “Connections 2045 Plan for Greater Philadelphia”, website. Retrieved, 5/13/2020.